
Marketing Analytics
Dashboard
An AI-powered marketing analytics dashboard that helps teams track campaign performance, understand customer behavior, and generate automated insights from marketing data.
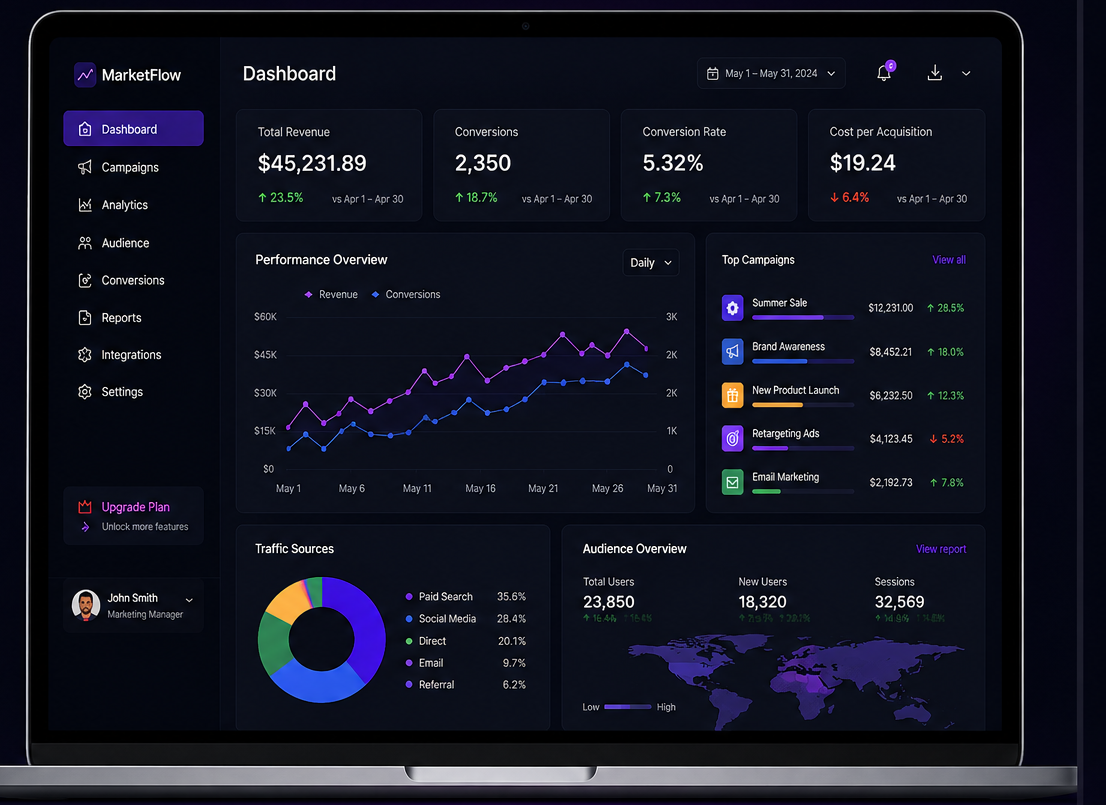
Overview
Marketing Analytics Dashboard is a web-based analytics platform designed to help marketing teams monitor campaign performance, traffic sources, leads, conversion rates, and customer engagement from one centralized dashboard.
To make the dashboard more useful for decision-making, AVEO added AI-powered insight features that help summarize campaign performance, detect unusual changes, and generate simple recommendations based on marketing data. The platform helps the marketing team reduce manual reporting work and understand campaign performance faster.
The Challenge
The client's marketing team was using multiple tools and spreadsheets to track campaign performance. Preparing weekly reports took time, and managers still needed to manually review data to understand what changed, what improved, and which campaigns needed attention.
Key challenges- Campaign data was spread across different sources
- Weekly reports were prepared manually
- The team needed clearer visibility into leads, traffic, and conversion performance
- Marketing managers needed simple summaries instead of reviewing many charts
- It was difficult to quickly identify unusual changes in campaign performance
- The team wanted AI assistance, but only for practical reporting and insight generation
Our Solution
AVEO designed and developed a marketing analytics dashboard that brings campaign data, traffic sources, lead performance, and conversion metrics into one clear interface. On top of the dashboard, AVEO implemented AI-powered features to automatically summarize campaign results, highlight key changes, detect unusual trends, and suggest practical next actions — AI embedded directly into the marketing reporting workflow, not a generic chatbot.
What we delivered- Web-based marketing analytics dashboard
- Campaign performance overview
- Traffic source reporting
- Lead and conversion tracking
- Custom date range filters
- Interactive charts and data visualization
- AI-generated campaign summaries
- AI insight cards for key changes
- Anomaly detection for unusual metric changes
- Suggested next actions for campaign improvement
- Exportable marketing reports
- Backend APIs for marketing data
- User access control
- QA testing across common browsers
Results / Impact
Faster Marketing Reporting
The team reduced time spent preparing weekly reports manually.
Clearer Campaign Insights
AI summaries helped managers understand campaign performance faster.
Better Issue Detection
Unusual metric changes could be identified more quickly from the dashboard.
More Data-Driven Decisions
Marketing managers could review key metrics, trends, and suggested actions from one place.
Practical AI Adoption
AI was used inside a real marketing workflow to support reporting, analysis, and decision-making.
Key Features
Campaign Performance Dashboard
Users can view campaign performance, traffic, leads, conversion rates, cost metrics, and engagement trends from one dashboard.
AI Campaign Summary
The system automatically generates short summaries of campaign performance, helping managers understand results without manually reading every chart.
AI Insight Cards
The dashboard highlights important changes such as rising traffic, lower conversion rates, high-performing channels, or campaigns that need attention.
Anomaly Detection
The system helps detect unusual changes in key metrics such as sudden drops in leads, spikes in traffic, or changes in conversion performance.
Traffic Source Tracking
Users can monitor performance across organic search, paid ads, social media, email, and referral channels.
Report Export
Users can export selected reports with AI-generated summaries for internal meetings and weekly updates.