
Logistics
Dashboard
A web-based logistics dashboard that helps operations teams track shipments, monitor delivery routes, and improve visibility across daily supply chain activities.
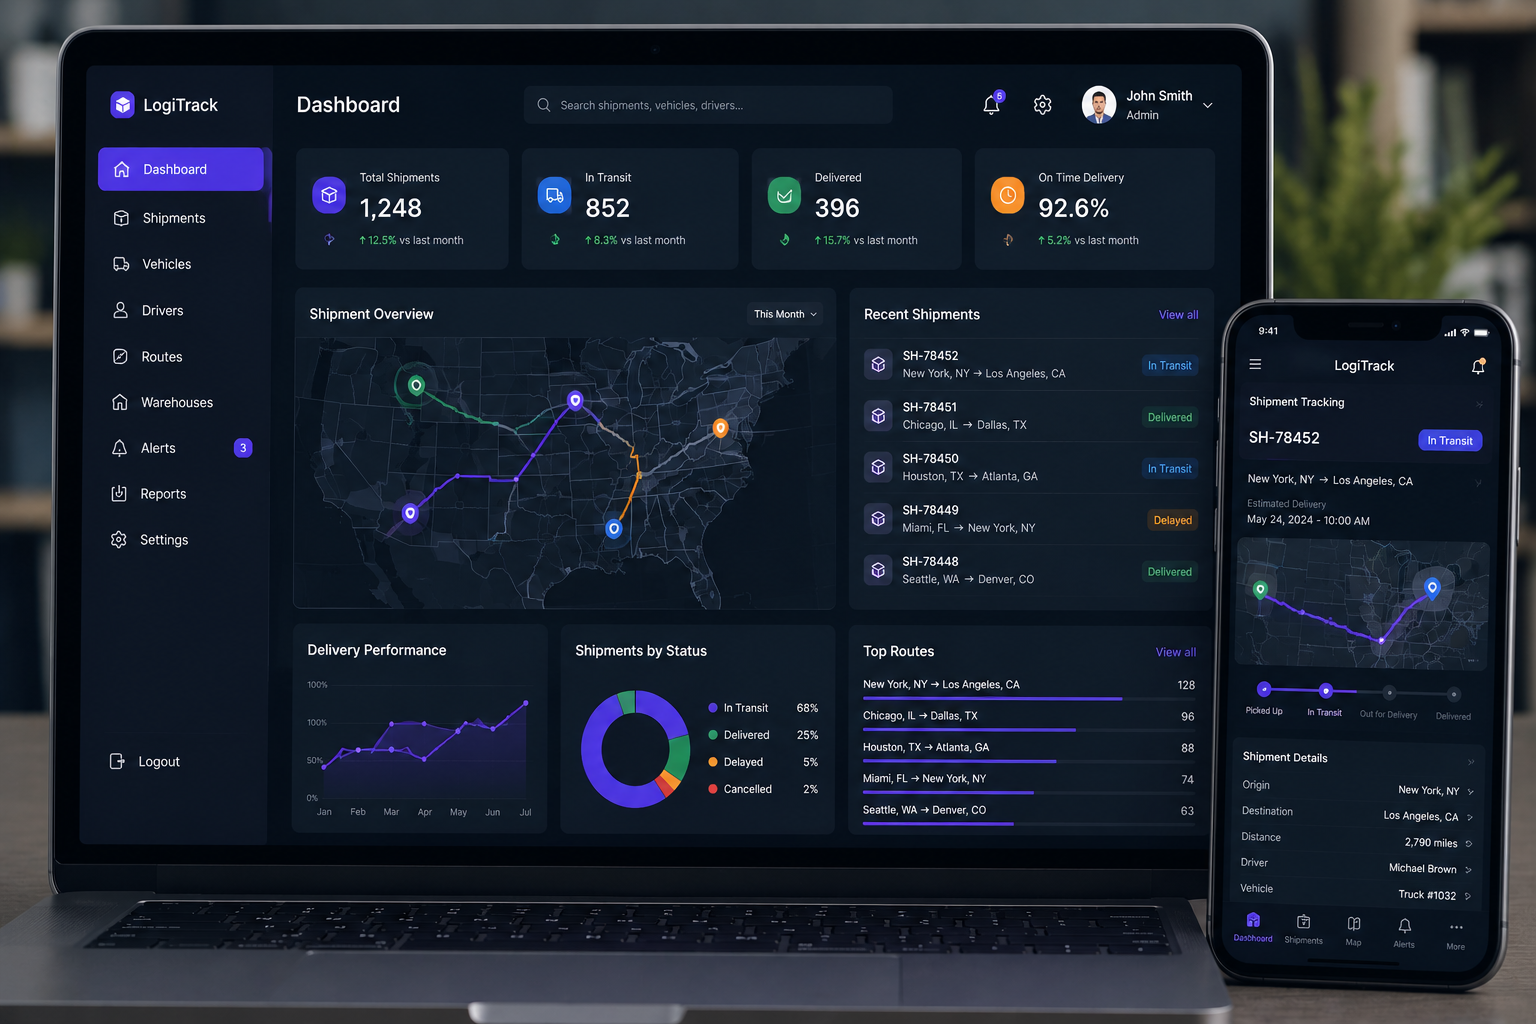
Overview
Logistics Dashboard is a web-based platform developed for a logistics company in Singapore to help their operations team monitor shipment status, delivery progress, route activity, and key logistics performance metrics.
The platform gives managers and operations staff a centralized view of daily delivery activities, helping them identify delays, review route performance, and reduce manual reporting work.
The Challenge
The client needed a clearer way to monitor logistics operations across multiple routes and shipment statuses. Their existing process relied on disconnected tools, manual reports, and spreadsheet updates, which made it difficult to get a reliable view of daily operations.
Key challenges- Shipment data was managed across different tools
- Delivery status updates were difficult to monitor in real time
- Operations reports required too much manual preparation
- Route and delivery performance were hard to compare
- The team needed a dashboard simple enough for daily use
- The system needed map-based visibility for delivery activities
Our Solution
AVEO designed and developed a logistics dashboard that centralizes shipment information, delivery status, route data, and operational KPIs in one interface. The frontend was built with Vue.js, the backend with Laravel and MySQL. Mapbox was integrated for route visualization, and Redis was used to improve performance for frequently accessed operational data.
What we delivered- Web-based logistics dashboard
- Shipment tracking overview
- Delivery status management
- Route visualization with map integration
- Operational KPI dashboard
- Search and filter functions
- Delivery performance reports
- Backend APIs for shipment and route data
- Role-based user access
- QA testing across common browsers
Results / Impact
Better Operational Visibility
The team can monitor shipment status, delivery routes, and daily logistics activity from one centralized dashboard.
Reduced Manual Reporting
The dashboard helps reduce time spent preparing daily shipment and delivery reports.
Faster Issue Detection
Delayed shipments and route issues can be identified more easily.
Improved Team Coordination
Operations, warehouse, and delivery teams have a clearer shared view of logistics activity.
More Data-Driven Operations
Managers can use KPI reports and delivery data to review performance and plan improvements.
Key Features
Shipment Tracking
Operations teams can view shipment status, route information, delivery progress, and shipment details from one dashboard.
Route Visualization
Map integration helps users review delivery routes and identify areas where delays or delivery issues may occur.
Delivery Performance Dashboard
The dashboard shows key metrics such as delivered shipments, in-transit shipments, delayed items, and on-time delivery rate.
Search & Filters
Users can search shipments and filter data by status, date, route, delivery location, or assigned driver.
Reports & Analytics
Managers can review simple reports and charts to understand delivery performance and daily operations.
Role-Based Access
Different users can access dashboard features based on their role, such as admin, operations manager, or warehouse staff.